Net Promoter Score – Tips and Traps

Net Promoter ScoreSM (NPS®) is the most popular customer experience metric measured by companies around the world, however many NPS programs don’t translate through to the desired gains. Let’s look at several tips and traps in NPS deployments.
An NPS survey ask customers to rate an organisation on a scale of 0 to 10. Customers are then divided into one of three groups: detractors (0-6), passives (7-8) and promoters. The score is based on the customer’s likelihood to recommend to family or a colleague, and is a predictor of customer loyalty and retention.
The organisation’s overall NPS score is calculated by deducting the percentage of Detractors from the percentage of Promoters, and can range from -100 to +100. Any score above 0 can be considered ‘good’ as it means the organisation has more Promoters than Detractors. While it varies hugely from industry to industry, the average NPS score is thought to be around 32.
Transactional NPS v. Enterprise NPS
One of the first traps that executives fall into is to confuse transactional NPS (for example, how a customer rates their just-completed service experience with a contact centre), with enterprise NPS (which surveys the customer on their total relationship with the company). Often there is a disconnect between the two scores, and the reason is that enterprise NPS is influenced by many factors outside the control of the sales and service department. A poor NPS at the enterprise level may not mean the contact centre is performing poorly at all. In fact in many cases, it is a result of dissatisfaction with the company’s product – pricing may be too high, quality may be poor – or negative brand perception. The tip here is to be very clear with customers what you are asking them to rate you on.
NPS results vary by channel…and culture
Depending on which channel you use to measure NPS, the results will be quite different. A live survey by phone, for example, will elicit a more positive score than an email survey due to the anonymity of the latter. Further, scores vary based on culture, giving rise to issues with a global company comparing its NPS results in different markets: some cultures are harsher than others in their assessment of service experiences.
The pitfall of a single question
NPS surveys ask a single question, which is both compelling in its simplicity, but potentially frustrating in lack of detail. We need to know why our customers are detractors, therefore supplementary questions are recommended so we can take actions based on insights.
NPS scores may cloud the “real issues”
If a company has a high-performing workforce in its contact centre, the NPS may look deceptively more positive than it should: talented agents can use their interpersonal, soft skills to “turn around” unhappy customers, masking poor processes and product issues, yet eliciting high net promoter scores. This is one of the reasons companies should not rely solely on NPS as a customer experience metric. It is important to also monitor live customer interactions and look at other metrics such as customer effort, which measures how easy it was for the customer to get their query resolved.
On the flip side, transactional NPS may appear more negative than it should due to the frontline not being truly empowered to resolve a customer’s issue on first contact. This may be due to an overly authoritative management style, inadequate knowledge management systems, or broken processes in the back office.
The bottom line
Always remember to dissect your NPS results if they don’t seem to add up, and do a health check against correlating metrics such as Customer Effort, before pointing the finger at Customer Service!
Net Promoter, NPS, and the NPS-related emoticons are registered service marks, and Net Promoter Score and Net Promoter System are service marks, of Bain & Company, Inc., Satmetrix Systems, Inc. and Fred Reichheld
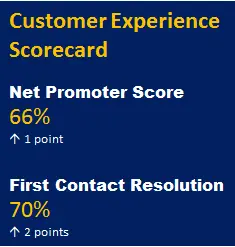
If you require help designing your NPS program or Customer Experience Scorecard, please contact us.
Related Content
Multimodal Customer Service
Contact Centres in Australia
Last updated on: October 26, 2022
